|
Mean, Mode, Median with Grouped Data Find the mean, median and mode for this grouped data of test scores. |
|||||||||||||||||||
 |
This problem can certainly be solved by entering ALL 35 scores into one list, with 65 appearing twice, 70 appearing 3 times, and so on. Dealing with
the data's frequencies, however, may accomplish the task more quickly. |
|||||||||||||||||||
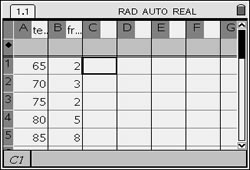
Method 1: Enter the data into two lists (spreadsheet). Enter the data on a List & Spreadsheet Page. (See Lists and Spreadsheets for entering data.) |
|
||
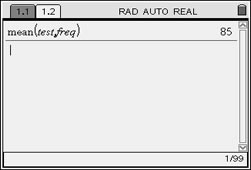
Find the Mean: Open a Calculator Page. This time we will tell the calculator the list containing the scores followed by the list containing the frequencies. Notice the comma separating the lists. The mean is 85. |
|
||
|
|||
Find the Mode: |
|||
Method 2: Enter the data into two lists (spreadsheet). (See Lists and Spreadsheets for entering data.) |
 |
||
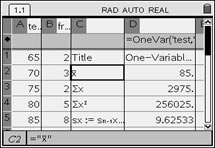
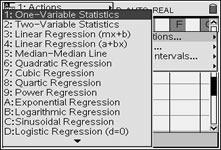
The One Variable Statistics option will allow for the entry of frequencies of data.
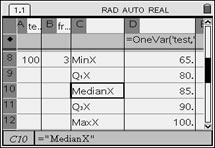
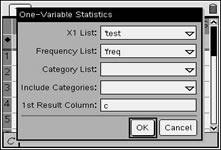
Press MENU, #4 Statistics, #1 Stat Calculations, and choose #1 One-Variable Statistics. Notice how the frequency list, freq, is used in the set up at the right. Read off the Mean and the Median from the list of information:
|
When prompted for number of lists, enter 1.
Under "Frequency List:" enter freg. |
||
Find the Mode: The mode can be quickly determined by examining the chart to see which score occurred most often. No calculator work needed. The mode is 85. |
|||
![]()
Table of Contents | MathBits.com | Terms of Use