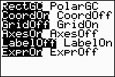
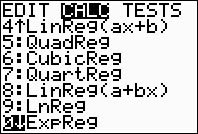
From STAT CALC:
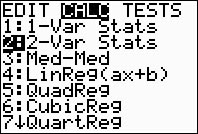
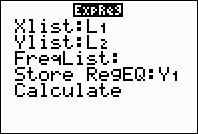
you now see ...
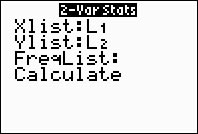
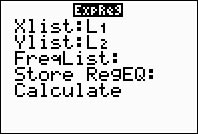
Note: For most situations, leave FreqList blank.
FreqList accepts list names only!
When left blank, the frequency is assumed to be 1.
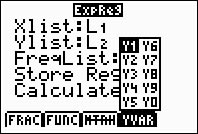
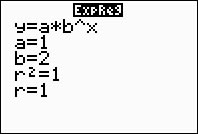
After choosing Calculate (ENTER), you see ...
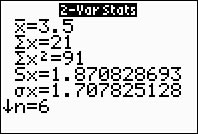
This is a temporary results screen.
Pressing CLEAR will
return to a blank HOME screen.
If you need to see the results again, arrow up on the HOME screen and press ENTER.
Note that lines in MathPrint mode scroll left and right.
Lines in Classic mode wrap on the screen.