Box and Whisker Plots
Box and Whisker Plots
Given the data set
{85, 100, 97, 84, 73, 89, 73, 65, 50, 83, 79, 92, 78, 10},
create a box and whisker plot to represent this data.
|
1. CLEAR out the graphs under y = (or turn them off). 2. Enter the data into the calculator lists. Choose STAT, #1 EDIT and type in entries. (See Basic Commands for entering data.) |
|
|
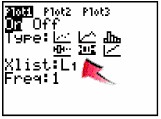
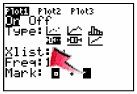
3. Two icons for Box-and-Whisker Plots: Choose the second icon for beginning level work. Press 2nd STATPLOT and choose #1 PLOT 1. You should see the screen at the right. Be sure the plot is ON, the second box-and-whisker icon is highlighted, and that the list you will be using is indicated next to Xlist. Freq: 1 means that each piece of data will be counted one time. |
|
| What about that
other icon? The first box-and-whisker icon is the modified box plot dealing with outliers. This modified version will not plot points that are 1.5*IQR beyond the quartiles. These points, called outliers, are plotted as individual points beyond the whisker in an attempt to give a more accurate picture of the dispersion of the data. Notice the two plots displayed at the top of this page representing the same set of data. NOTE: IQR stands for the Interquartile Range which is Q3 Q1. |
|
| 4. Seeing the graph: To see the box-and-whisker plot, press ZOOM and #9 ZoomStat. Press the TRACE key to see on-screen data about the box-and-whisker plot. The whiskers extend from the minimum data point in the set to the first quartile, and from the third quartile to the maximum point. The box itself is defined by Q1, the median and Q3. The spider will jump from the minimum value to Q1, to median, to Q3 and to the maximum value. |
|
| 5. Placement of the
graph: The calculator ignores y-values when plotting box and whiskers. You can plot up to 3 box-and-whisker plots on one screen display. The first will be at the top of the screen, the second in the middle and the third at the bottom. |
|
![]()
Finding Your Way Around
TABLE of CONTENTS