Table of Contents MathBits.com Terms of Use TI-84+ WebSite MathBits.com Table of Contents MathBits.com Terms of Use TI-84+ web site

Exponential Graphs
This page will point out how to enter and adjust graphs of square root functions and cube root functions on the TI-Nspire graphing calculator. 

Example:  Graph an exponential function.

Steps:
To start, from choose Sketchpad B: Graphs OR Documents 1. New

From "Documents:

• If you see "Save?", usual response is "no".


• Choose option 2. Add Graphs


Use the caret key ^ (to the left of x2 )
to enter an exponent where 2 ^ x becomes 2x.

OR
Get the exponent symbol from template list:
f
1(x) =
• Type "x" in the template.

to see the graph.

Note: The horizontal asymptotes (f4 and f5) have been graphed separately.

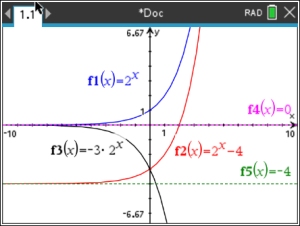
Exponential Functions

Exponential functions have
horizontal asymptotes.
These are lines that the graphs approach, getting closer and closer, but they do not touch nor cross these lines.

Several possible graphs are shown:

f1: y = 2x parent style function
horizontal asymptote at y = 0
f2: y = 2x - 4 translated function 4 units down
horizontal asymptote at y = -4
f3: y = -3•2x stretch function, negated function reflected over x-axis
horizontal asymptote at y = 0