
Rational Graphs
Be careful when working with rational graphs!
It may be the case, with some rational graphs, that what is being shown
on the graph
is not a complete display of what is actually happening.
Example 1:
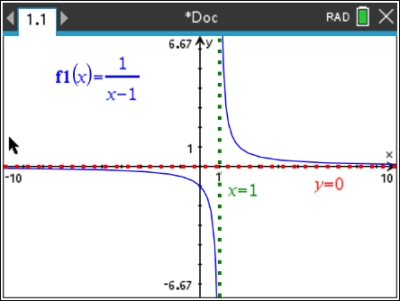
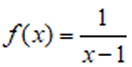
Graph the following rational function and
state the domain of the function. |
Graph f (x).
 |
|
Answer: Observation of the graph shows there are no zeros. It also shows a possible vertical asymptote at x = 1 and a possible horizontal asymptote at y = 0.
So, the domain is {x | x  1}. 1}.
Note: The asymptotes were drawn on the graph AFTER the function was graphed. They were not part of the original graph prepared by the calculator. |
| |
|
Example
2:
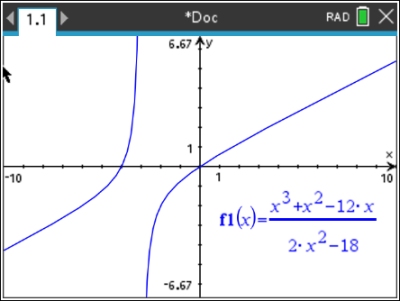
Graph the following rational function and state the domain of the function.
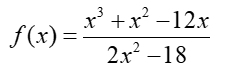
Answer: Observation of the graph shows zeros
at x = -4 and x = 0. It also shows a possible vertical asymptote at x = -3.
So, the domain is {x | x -3}.
Close, but not correct!!!
While the graph showed many of the features of the function, it failed to show one additional feature. There is actually a "HOLE" in the graph at x = +3.
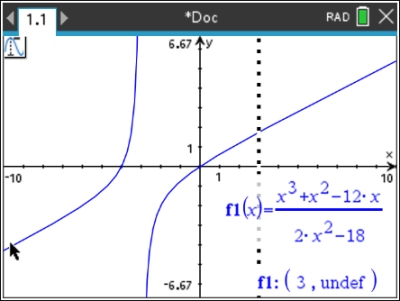
Using a TRACE on the graph, will show that the function is undefined at x = 3.
So, where did the HOLE come from???
Factoring and simplifying the function expression, will show what is actually happening.
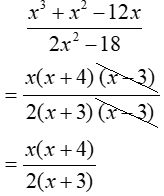
Ah, Bach!!! There is a factor of (x - 3) in the denominator, creating undefined status
at x = 3.
If the simplification of the function shows a common factor between the numerator and denominator, the graph will have a hole determined by that factor set equal to zero.
(x - 3 = 0 so hole at x = 3) |
Graph f (x).
There is really more going on here than this graph is showing. There is a "hole" in the graph
at x = 3. While a "hole" is not shown at x = 3, the function is actually undefined at x = 3.
No asymptotes are shown in this graph.
Vertical asymptote at x = -3.
Using the TRACE function, the undefined term
(the "hole") will appear at x = 3.
The vertical dotted line is the active line of the Trace command.
You will need to rely on the algebraic simplification of the function to give you the full story of what is happening in this graph. |
So, the domain is actually{x | x ±3}.
|
So, why is this happening?
The answer is based on how graphing algorithms work and the limitations of a pixel-based display.
Graphing calculators sample a finite number of x-values across the screen, calculate the y-values, and connect the points (in "connected" mode).
If an undefined point (like a "hole") falls between two sampled pixel columns, the calculator skips that point and connects the adjacent points, not indicating the "hole". This is what occurred in this graph at x = 3.
|
In conclusion,
rational functions can take on the form of f (x) / g(x).
Vertical asymptotes of these functions occur when g(x) = 0, in general.
Exceptions apply when f (x) and g(x) have common roots, which produce "holes".
Horizontal asymptotes are based upon the relationship of the degrees of f (x) and g(x).
CAS version: The CAS version
of the calculator will be
capable
of
offering more in depth information about rationals. TBA
|
NOTE: If you want to add the known asymptotes to a graph, you can:
1. Add an additional function, y = some value, to create the horizontal asymptote.
2. Add a "relation" to
create the vertical asymptote, x = some value.
To add a relation, use MENU - #3 Graph Entry/Edit, #2 Relation and enter x = -3.
(Or you can get behind the "=" in f (x) = in the entry bar, and delete the "=".
This will cause a template to appear which will contain "relation".)
3. Change to a dotted (or dashed) line :
click on the line, choose #2 Attributes, choose 2nd option for dotted or dashed lines.
4. Change color: click on the line, choose B Color, and then your color choice.
,

Table of Contents | MathBits.com | Terms of Use
|