|
Working with quadratic inequalities is similar to
working with linear inequalities.
(See
Linear Inequalities
and
Inequality Graphing)
Consider the
following examples:
|
S I N G L E
V A R I A B L E: |
|
1. |
Solve:  |
| |
1. Enter the left side of the
inequality into Y1.
2. Enter the right side of the inequality into
Y2.
3. Enter the inequality into
Y3 using the inequality symbols found
under 2nd MATH (TEST).
Remember the Y1
and Y2 are found
under Vars
→Y-VARS,
#1Function.
4. Hit
GRAPH.
Just as we saw in
Linear Inequalities, a small
bar appears representing the graph of the value
1, showing where the
inequality is true. In this case, the inequality
is true for 2 < x < 5. To determine
the "exact" values for the endpoints, use the
INTERSECT option (2nd
TRACE (CALC) #5 intersect) with
Y1 and
Y2.
Looking at the table shows that the
Y3 values
alternate between being a 0
(false) and a 1 (true).
(Arrow to the right to "see" the column for
Y3.
Remember that < will not "include" the
endpoints. |


 |
| 2. |
Graph:
 |
| |
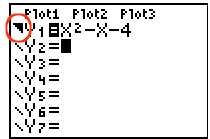
1. Set

2. Arrow to the far left of the equal sign and hit
ENTER until the "greater
than" symbol appears. If you go past it, keep
hitting ENTER, as it will
come around again.
3. Hit GRAPH.
Remember, when working with inequalities
on the graphing calculator, YOU must decide if the graph
(in this case the parabola) is drawn as a dotted or
solid entity. The graph is solid if the equation
includes "equal to". This graph would be drawn
solid.
|
 |
| 3. |
Graph
the system: Only
One Root? |
| |
Solve:

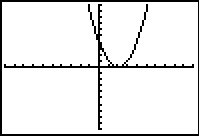
When graphed, this equation only
intersects the x-axis in one location. This tells
you that this root repeats itself.
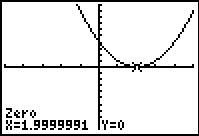 |
If a reading appears such as
1.9999991, the actual answer is most likely the
number 2. Check your assumption that the
answer is 2 by substituting 2 into the original
equation to see if it satisfies the equation.
|
|
Standard 10 x 10 window
 |
| 4. |
What if
the graph does not intersect the x-axis???
(or intersect option shows no intersections) |
| |
Solve:

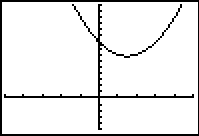
When graphed, this equation does NOT
intersect the x-axis. This tells you that the
roots of this equation are complex
values. Dig out
the quadratic formula to find the roots.
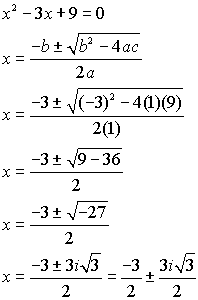 |
Window [-5,5] x [-5,15]
 |
| 5. |
Need to
WRITE a quadratic equation from a graph? |
| |
If you are given the
visual graph of a quadratic equation and you are given
or can identify at
least 3 points, you can use the Quadratic Regression
process to create the equation of the graph.
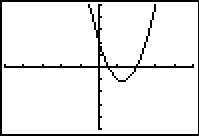
Write the equation of the
parabola shown at the right, given that the points (0,2),
(-1,9) and (3,5) are on the graph.
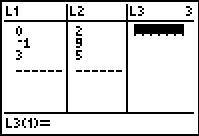
1. Enter the points into
L1 and
L2 (x-coordinate
in L1 and
matching y-coordinate in L2)
(See
Basic Commands for Stats if you need more
assistance.)
2. Press
STAT. Arrow over to
CALC. Choose
#5 QuadReg.
3. On the home screen:
QuadReg L1, L2
4. Press ENTER.
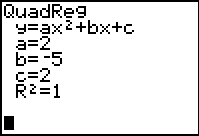
You will see the screen at the right showing you
the coefficients of the quadratic equation.
This equation is
 |
|
|