|

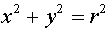
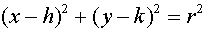
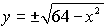
Conics
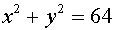
Solution:
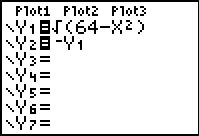
- Enter the equation into Y= by
solving for y.
- Enter the positive square root into Y1.
- Enter the negative square root into Y2,
or enter the negation of Y1.
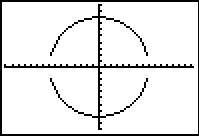
- If you choose ZOOM #6 (the standard
window), the graph will appear to be an ellipse rather than a circle
due to the 3/2 aspect ratio of the viewing screen (the standard
viewing screen is not a square).
- Choose ZOOM#5 ZSquare to create a
viewing window where the units on both axes are the same length.
|
|
NOTE:
* You may notice that the "vertical" edges of the graph will
not appear in the viewing window. The viewing screen
cannot graph points that fall between pixels.
* Since the positive and negative square roots were graphed
as two separate equations, the TRACE function will not move
smoothly between the two sections of the graph. The up
arrow can be used to move between the two sections of the
graph. The cursor will disappear if it is moved beyond
the domain for which x is defined.
|
|
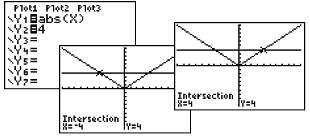
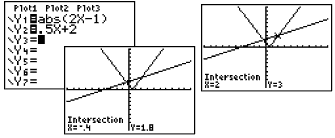
Example 1: Solve:

-
Enter left side in Y1.
You can find abs( ) quickly under the
CATALOG (above 0)
( or
MATH → NUM, #1 abs( )
-
Enter right side in Y2
-
Use the Intersect Option (2nd
CALC #5) to find where the graphs intersect. Move the
spider near the point of intersection, press
ENTER. Simply hit ENTER
twice more. You must repeat this process to find the second point
of intersection.
-
Answer: x
= 4; x = -4
|

 |
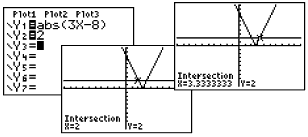
Example 2: Solve:

- Answer: x = 2;
x = 3.3333333
The x value is stored in the calculator's memory. If you wish
to change 3.333333333 to a fraction, simply return to the home
screen, hit x, hit Enter.
Now, change to fraction. (2nd MATH, #1►Frac
)
Answer: x = 2;
x = 10/3
|
|
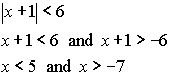
Example 3:
Solve: 
|
|
|
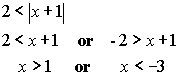
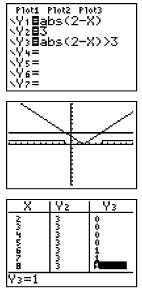
Example 4:
Solve:

Boolean Check:
|
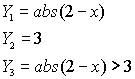 |
(The inequality symbols are under
the
TEST Menu - 2nd MATH.)
Answer: x
< -1; x > 5 |
You could also
enter
 ( using Y1 and Y2
found under
( using Y1 and Y2
found under
Vars →Y-Vars, Function) |
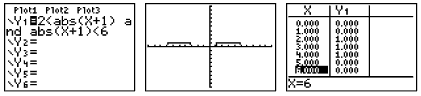
Where the inequality is true, y-values on the graph will be a 1.
If you look at the table, 0's will be listed where the inequality is
false and 1's will be listed where the inequality is true.
Determine exact cut off points by using the intersection option.
Remember that the calculator cannot draw an open or closed circle
on the intervals. You will have to determine which circle is
needed based upon whether the inequality includes "equal to".
Find the endpoints by using the intersect option (2nd TRACE #5
intersect).
If you turn off the axes (FORMAT - 2nd ZOOM),
you will be able to see the graphing of the 0's and 1's more clearly.
Notice that the small vertical segment connecting the 0's to the 1's
is simply the calculator being set in "connected" mode.
Change to "dot" mode to remove this segment. |
 |
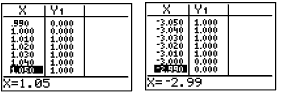
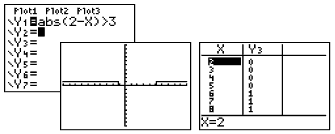
| You "can" enter the inequality directly. Since you
will not have the two graphs from which to determine the
intersection points, you will need to
examine the table to determine the exact value of the
open/closed endpoints. |
 |

BACK
|