
Mean Absolute Deviation
Mean Absolute Deviation
The Mean Absolute Deviation (MAD) of a set of data
is the average distance
between each data value and the mean.
The steps to find the MAD include: |
While we could work through each of these steps on the calculator's home screen,
let's, instead, try to utilize the calculator's features to minimize our work.
We will look at two different approaches to find the population MAD.
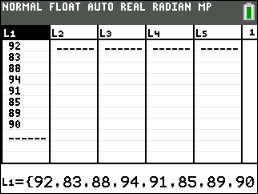
Data Set: {92, 83, 88, 94, 91, 85, 89, 90}
Find the Mean Absolute Deviation.
Method 1: (doing one step at a time with the lists = easy)
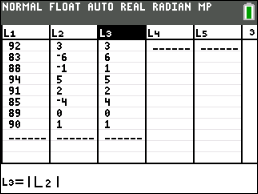
Enter the data: Step 1: Enter the data into a list (L1) (See Basic Commands for entering data.) 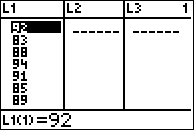 |
 |
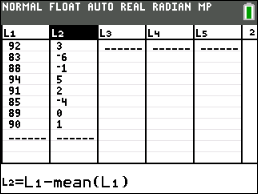
Calculate the differences:
Step 2: Tell L2 to calculate the values from L1 minus the mean of L1. Arrow up onto L2. Enter L1 - mean(L1) (you can find "mean" in the Catalog) [mean( is also found in 2nd LIST, MATH, #3 mean( ] Hit ENTER. Notice that if you add the sum of the positive differences and the negative differences, you will get zero. |
 |
Take the absolute value of the differences:
Step 3: Arrow up onto L3. Enter abs(L2) (you can find "abs" in the Catalog) Hit ENTER. (This step could have been combined with Step 2.) |
 |
| Find the mean (average) of the absolute values: Step 3: Go to the HOME screen. (2nd QUIT) Enter mean(L3). Hit ENTER. This value is the Mean Absolute Deviation (MAD). |
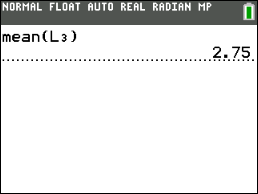 |
Since the MAD is small, it implies that the mean of 89 is indicative of the other values within the data set. |
|
![]()
|
Method 2: (doing most work in one statement - harder to remember the locations of the functions) Enter the data: Step 1: Enter the data into a list (L1) (See Basic Commands for entering data.) |
|
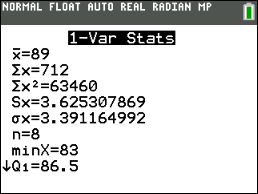
Have the calculator compute the mean and the count of entries.
Step 2: Hit STAT → CALC Choose #1 1-Var Stats On the home screen: #1 1-Var Stats L1 Hit ENTER. The calculator now has stored the value for the mean, |
 |
|
Compute the answer using one formula entry:
Step 3: • Go to the HOME screen. • left parenthesis • 2nd LIST → MATH #5 sum( • from Catalog, abs( • Enter L1 (2nd and the key for "1") • Subtraction symbol • VARS, #5 Statistics, #2 • Division symbol • VARS, #5 Statistics, #1 n Hit ENTER. |
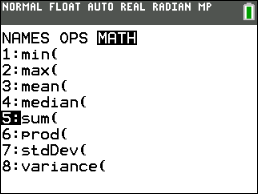 2nd LIST → MATH #5 sum( |
 VARS, #5 Statistics, #2 |
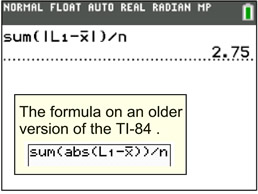 Hit ENTER |
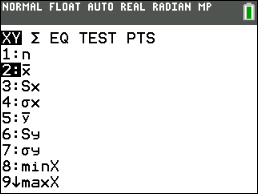
| NOTE: When adding the entries in a list, be sure to use the sum( function which appears under LIST - MATH. Do not use the sigma notation ∑ from ALPHA-WINDOW, as it does not understand how to access numbers from a list. | |
![]()
Finding Your Way Around
TABLE of CONTENTS