|
Exponential Regression Model Example
(when doing an exponential regression, the y-values must
be greater than 0)
|
|
|
Data:
The
data at the right shows the cooling temperatures of a freshly brewed cup of coffee
after it is poured from the brewing pot into a serving cup.
The brewing pot temperature is approximately 180º F.
|
| Time (mins) |
Temp ( º F) |
0 |
179.5 |
5 |
168.7 |
8 |
158.1 |
11 |
149.2 |
15 |
141.7 |
18 |
134.6 |
22 |
125.4 |
25 |
123.5 |
30 |
116.3 |
34 |
113.2 |
38 |
109.1 |
42 |
105.7 |
45 |
102.2 |
50 |
100.5 |
|
| Task: |
a.) |
Determine an exponential
regression model equation to represent this data. |
| |
b.) |
Graph the new equation. |
| |
c.) |
Decide whether the new equation
is a "good fit" to represent this data. |
| |
d.) |
Based upon the new equation, what
was the initial temperature of the coffee? |
| |
e.) |
Interpolate data: When is the coffee at
a temperature of 106 degrees? |
| |
f.) |
Extrapolate data: What is the predicted
temperature of the coffee after 1 hour? |
| |
g.) |
In 1992, a
woman sued McDonald's for serving coffee at a
temperature of 180º that caused her to be
severely burned when the coffee spilled. An
expert witness at the trial testified that liquids
at 180º will cause a full thickness burn to human skin in two to seven seconds. It was stated
that had the coffee been served at 155º, the
liquid would have cooled and avoided the serious
burns. The woman was awarded over 2.7
million dollars. As a result of this famous case, many
restaurants now serve coffee at a temperature around
155º. How long should restaurants
wait (after pouring the coffee from the pot) before
serving coffee, to ensure that the coffee is not
hotter than 155º ? |
| |
h.) |
If the temperature in the room is
76° F, what will happen to the temperature of the
coffee, after being poured from the pot, over an extended period
of time? |
|
TI-84 Plus CE screen shots are shown for calculations.
Older models can follow these same steps.
Step 1.
Enter the data into the lists.
For basic entry of data, see Basic
Commands. |

|
Step 2.
Create a scatter plot of the data.
Go to STATPLOT (2nd Y=) and choose the first plot. Turn the plot
ON, set the icon to Scatter
Plot (the first one), set Xlist to L1 and Ylist to
L2 (assuming that is where
you stored the data), and select a Mark of your choice and a color.
To see the scatter plot press ZOOM and #9 ZOOMSTAT, Hitting TRACE and right arrow will move along the data points.
 |


|
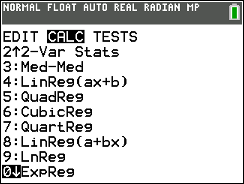
Step 3.
Choose Exponential Regression Model.
Press STAT, arrow right to
CALC, and arrow down to 0: ExpReg. Hit
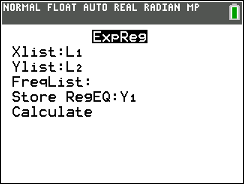
ENTER. When
ExpReg appears on the home
screen, type the parameters L1,
L2, Y1. The Y1 will put the equation into Y= for you.
(Y1 comes from VARS → YVARS, #Function, Y1)
  |

The exponential regression equation is
(answer to part a)
r2 and r will show up if STAT DIAGNOSTICS in turned on (under MODE). |
Step 4.
Graph the Exponential Regression Equation from
Y1.
ZOOM #9 ZoomStat to see
the graph. |

(answer to part b)
|
Step 5.
Is this model a "good fit"?
The correlation coefficient, r, is
-0.9849556976 which places the correlation into the
"strong" category. (±0.8 is the marker for "strong"
correlations)
The coefficient of determination, r
2, is 0.9701377262 which means
that 97% of the total variation in y can be
explained by the relationship between x and y. Yes, it is a very "good fit".
(answer
to part c) |
Step 6.
Based upon the new equation, what was the
initial temperature of the coffee?
The exponential regression equation is
where x stands for time. The initial
temperature would occur when the time equals zero.
Substituting zero for x gives an initial temperature of
171.462º.
(answer to part
d) |
Step 7. Interpolate: (within the data)
When
is the coffee at a temperature of 106 degrees?
Go to TBLSET (above WINDOW) and set the TblStart to 42 (since 42 minutes gives a temperature
close to 106º in our chart).
Set the delta Tbl to a decimal setting of your choice.
Go to TABLE (above GRAPH) and arrow up or down
to find your desired temp of 106º, in the Y1 column.
(answer to part e: after approx. 40.7 minutes) |


|
Step 8. Extrapolate
data: (beyond the data)
What is the
predicted temperature of the coffee after 1 hour?
Change 1 hour to 60 minutes. With your
exponential equation in Y1,
go to the home screen and type
Y1(60).
Press ENTER.
(answer to part f: 84.4º F) |

|
Step 9. How long should the
restaurants wait (after pouring the coffee from the
pot) before serving coffee, to ensure that the coffee is
not hotter than 155º ?
Repeat procedure from Step 7:
(answer to part g: approx. 8.5
minutes) |
 |
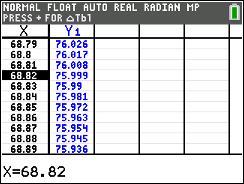
| Step
10. If the temperature in the room is
76° F, what will happen to the temperature of the coffee,
after being poured from the pot, over an extended period
of time?
The calculator's
exponential equation shows that the coffee will reach
room temperature after 68.8 minutes. This
exponential graph is asymptotic to the x-axis, implying that the y-values (degrees) approach zero. This can be seen by
observing successively larger values substituted into
the calculator's exponential equation (see
home screen substitutions below).
Even though the graph approaches zero asymptotically,
we know that the temperature of the coffee will stop cooling once it
reaches room temperature of 76º, and will not continue
following the
curve of the graph.
  |
| NOTE: The temperature of the coffee stops cooling when it reaches the room temperature of 76°. The existence of the room temperature will actually affect the final exponential equation. Instead of the graph being asymptotic to the x-axis, the graph is actually asymptotic to the room temperature. If you visualize the room temperature as y = 76º, you will notice that there will be changes in the graph and consequently changes in the resulting equation. You can see how room temperature affects the graph and the equation for this problem at Newton's Law of Cooling. |
|