|
Linear
Regression with Biological Data
(or the realities of working with real-life
data)
|
Data: The following data shows the relationship between chirps per
second of a striped ground cricket and the corresponding
ground temperature. NOTE: There seems to be some confusion relating to the "units" used in Pierce's data. According to the text, The Song of Insects by George W. Pierce, 1948, page 20, the information and unit labeling, as stated at this site, correctly reflects his findings.
|
|

Pierce (1948) mechanically measured the frequency (the
number of wing vibrations per second) of chirps (or pulses of sound) made
by a striped ground cricket, at various ground
temperatures. Since crickets are ectotherms
(cold-blooded), the rate of their physiological
processes and their overall metabolism are
influenced by temperature. Consequently, there
is reason to believe that temperature would have a
profound effect on aspects of their behavior, such
as chirp frequency.
In general, it was found that crickets did not sing at temperatures colder than 60º F. or warmer than 100º F. |
|
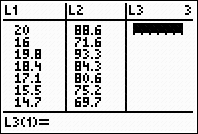
| Chirps/Second |
Temperature (º F) |
| 20.0 |
88.6 |
| 16.0 |
71.6 |
| 19.8 |
93.3 |
| 18.4 |
84.3 |
| 17.1 |
80.6 |
| 15.5 |
75.2 |
| 14.7 |
69.7 |
| 15.7 |
71.6 |
| 15.4 |
69.4 |
| 16.3 |
83.3 |
| 15.0 |
79.6 |
| 17.2 |
82.6 |
| 16.0 |
80.6 |
| 17.0 |
83.5 |
| 14.4 |
76.3 |
|
| Task: |
a.) |
Determine a
linear regression model equation to represent this
data. |
| |
b.) |
Graph the new
equation. |
| |
c.) |
Decide whether the
new equation is a "good fit" to represent this data. |
| |
d.) |
Extrapolate data:
If the ground temperature reached 95º, then at what
approximate rate would you expect the crickets to be
chirping? |
| |
e.) |
Interpolate data:
With a listening device, you discovered that on a
particular
morning the crickets were chirping at a rate of 18 chirps
per second.
What was the approximate ground temperature that morning? |
|
f.)
|
If the ground temperature should drop to freezing (32º F),
what happens to
the cricket's chirping rate? |
| |
Answers in this problem are to be
rounded to the nearest hundredth. |
|
Step 1. Enter the data into the lists.
For basic entry of data, see Basic
Commands. |
|
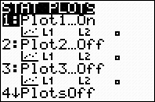
Step 2.
Create a scatter plot of the data.
Go to STATPLOT (2nd Y=)
and choose the first plot. Turn the plot
ON, set the icon to Scatter
Plot (the first one), set Xlist
to L1 and Ylist to
L2 (assuming that is where
you stored the data), and select a Mark of your choice.
  |
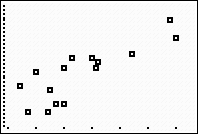
Obviously, there is some scatter to this data. This
variability is the norm, rather than the
exception, when working with biological data sets.
Real life data seldom creates a nice straight line.
|
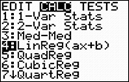
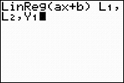
Step 3. Choose the Linear Regression Model.
Press STAT, arrow right to
CALC, and arrow down to
4: LinReg (ax+b). Hit
ENTER. When
LinReg appears on the home
screen, type the parameters L1,
L2, Y1. The Y1
will put the equation in to Y=
for you.
(Y1 comes from VARS → YVARS, #Function, Y1)
 |
 Older OS form. Older OS form. |
 Newer OS form. Newer OS form. |
|
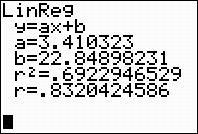
The linear regression equation is
y = 3.41x + 22.85
(answer to part a)
|
Step 4. Graph the Linear Regression Equation from
Y1.
ZOOM #9 ZoomStat to see
the graph. |
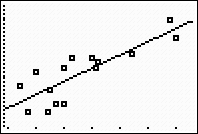
(answer to part b)
|
Step 5.
Is this model a "good fit"?
The correlation coefficient, r, is .8320424586
which just barely places the correlation into the
"strong" category. (0.8 or greater is a "strong"
correlation)
The coefficient of determination, r
2, is .6922946529 which means
that 70% of the total variation in y can be
explained by the relationship between x and y.
The other 30% remains unexplained.
Yes, it is somewhat of a "good fit".
(answer
to part c) |
 |
Step 6. Extrapolate:
(beyond the data set)
If the ground temperature reached 95º,
then at what approximate rate would you expect the
crickets to be chirping?
Go to TBLSET (above
WINDOW) and set the
TblStart to 20+ (since the highest temperature in the
data set had 20 chirps/second). Set the delta
Tbl to a decimal setting of your choice. Go to
TABLE (above
GRAPH) and arrow up or down
to find your desired temperature, 95º, in the Y1 column.
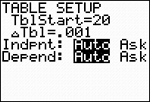 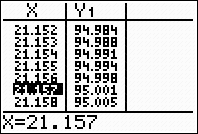
(answer to part d -- approx. 21.16 chirps/second) |
Step 7. Interpolate: (within the data set)
With a
listening device, you discovered that on a particular
morning the crickets were chirping at a rate of 18
chirps per second. What was the approximate ground
temperature that morning?
From the graph screen, hit TRACE,
arrow up to obtain the power equation, type
18, hit
ENTER, and the answer will
appear at the bottom of the screen.
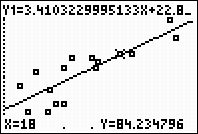
(answer to part e --
the ground
temperature will be approx. 84.23º F) |
Step 8. If
the ground temperature should drop to freezing (32º F),
what happens to the cricket's chirping?
|
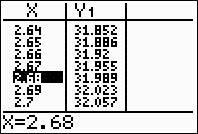 |
The TABLE tells
us that at 32º F there are 2.68 chirps per
second. So, what does this really mean?
Are the crickets cold?
These findings are a bit deceiving. At
32º F, the crickets are dead. The lifespan
of a cricket in a cold climate is very short.
The crickets spend the winter as eggs laid in
the soil. These eggs hatch in late spring
or early summer, and tiny immature crickets
called nymphs emerge. Nymphs develop into
adults within approximately 90 days. The adults
mate and lay eggs in late summer before
succumbing to old age or freezing temperatures
in the fall. |
|
Also, remember that the
further you extrapolate away from the data set,
the less reliable the information will be. |
|
|