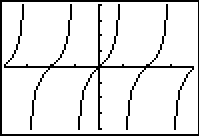
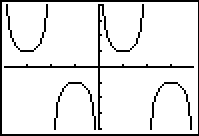
|
Enter the
function.
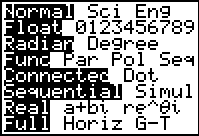
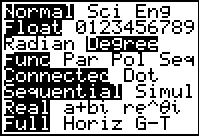
Set the MODE to
Radian. Choose
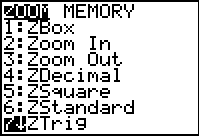
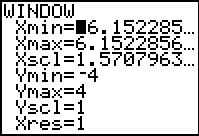
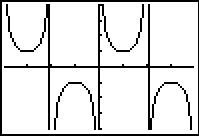
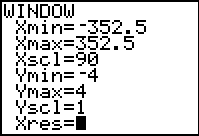
ZOOM #7 ZTrig
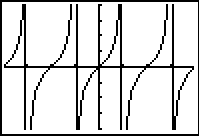
These vertical lines are not the asymptotes. They are simply the
calculator behaving as it should in "Connected" mode -- it is
"connecting" the points.
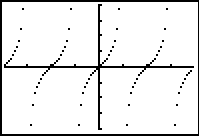
So, why am I not
seeing
"heartbeat" lines in Degree mode?
In Radian
mode, the calculator is never graphing the undefined points on the
graphs. The decimal approximations for these locations are slightly
"off" -- meaning that the graph is not undefined at these "close"
approximations and consequently points are plotted. When a point is
plotted, the connected mode engages
and connects adjacent points.
In Degree mode,
the calculator attempts to graph the actual undefined points. Such an
attempt produces an "error" and nothing is plotted for those
x-values. Consequently, a
break in the graph appears (a non-plotting), preventing the
connected mode from connecting adjacent
points, which prevents the creation of the
"heartbeat" line.
Finding Your Way Around TABLE of CONTENTS
|


