MathBits.com Table of Contents logo

Asymptotes - Was I Really Seeing Them?

[On older calculators, connected mode could create the illusion of "asymptotes".]

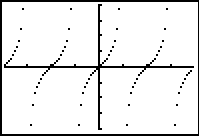
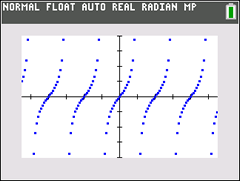
Graphing functions that had undefined x-values, such as various trigonometric functions, on the TI-83+ and TI-84+ (with OS prior to V2.40),  would show the appearance of graphed "asymptotes".
Were these really asymptotes? 
(
ANSWER:  No.  They were not asymptotes.)
There were simply the calculator working in "connected" mode.)

NOTE:  Starting with the TI-84+ Operating System V 2.40, this problem of connected mode creating the illusion of asymptotes no longer exists.


Let's take a look at what used to happen with graphing calculator technology, and compare to what is happing with the new models.

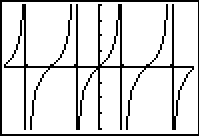
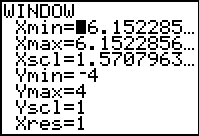
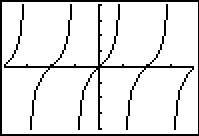
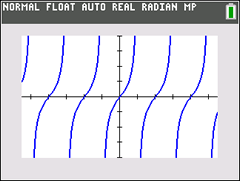
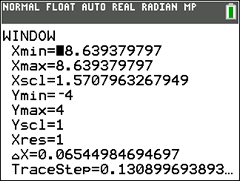
On the Older Models:

Let's examine some trigonometric graphs (with undefined values) in Radian MODE:
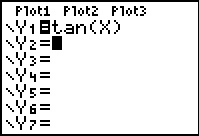
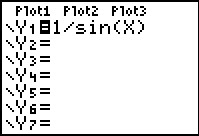
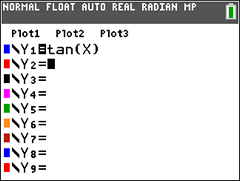
Graph y = tan(x)

Enter the function.                     
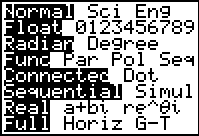
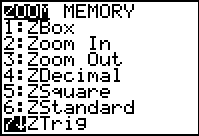
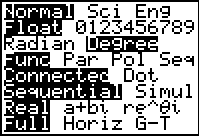
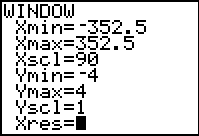
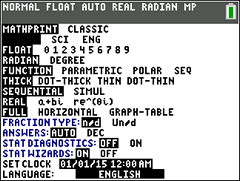
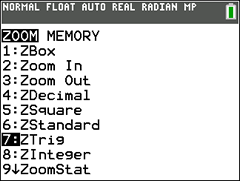
Set the MODE to Radian.               Choose ZOOM #7 ZTrig
1     2      

The Graph4

Window in ZTrig
5

The same graph in DOT mode.
  No asymptotes!!
6

These appearances of vertical lines were not the asymptotes.  They were simply the calculator behaving as it should in "Connected" mode -- it was "connecting" the points.


Graph y = csc(x)

This same problem occured with the graph of
y
= csc(x)
in Radian MODE.

Enter the function.
7

Graph using ZOOM #7 ZTrig
8


BUT.... when using
DEGREE MODE, these asymptote "illusions" did not appear.  Why??

Let's examine these same two functions in DEGREE Mode.
 y = tan (x)
y = csc (x)
Still in connected mode.

Set the mode to Degree
9

Window in ZOOM #7 ZTrig
10

y = tan(x)
11

y = csc(x)
12

Notice -- there are NO illusions of "asymptotes", or "heartbeat" lines, in these graphs.

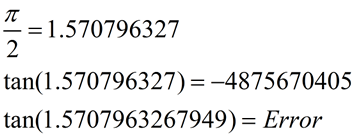
So, why did the calculator not show "heartbeat" lines in Degree mode?

The answer can be found by examining the windows created by ZTrig.

RADIAN - ZTrig
13

DEGREE - ZTrig
14

Note:  The Degree Mode uses 90 as the Xscl.
The Radian Mode does not truly use 15as Xscl.  It expresses this value as an approximate decimal.


The Radian Mode window was not truly using pi2as Xscl.
It expressed this value as an approximate decimal.

In Radian mode, the calculator is never graphing the undefined points on the graphs.  The decimal approximations for these locations are slightly "off" -- meaning that the graph is not undefined at these "close" approximations and consequently points are plotted.  When a point is plotted, the connected mode engages and connects adjacent points.
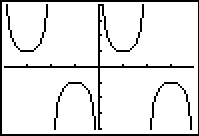
 

The Degree Mode window uses 90 as the Xscl.

In Degree mode, the calculator attempts to graph the actual undefined points.  Such an attempt produces an "error" and nothing is plotted for those x-values.  Consequently, a break in the graph appears (a non-plotting), preventing the connected mode from connecting adjacent points, which prevents the creation of the 
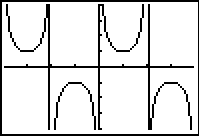
"heartbeat" line, or the "asymptote" illusion.

On the Newer Models:

Let's examine the trigonometric graph of tan(x) again in Radian MODE on a newer calculator:

Graph y = tan(x)

Enter the functioncap1

Set the MODE to Radian.     cap2

Choose ZOOM #7 ZTrigcap3


The Graph
cap4

Window in ZTrig
cap5

The same graph in DOT-THICK mode
 
cap6

The newer technology has addressed the problem of connected mode plotting points where functions are actually undefined. Consequently, the graphs now appear as they should in connected (thick) mode.
It appeaars that the increased decimal representations on the newer calculators allow for the undefined values to be recognized and not plotted. Thus, no illusional asymptotes or heartbeats are graphed.

tanproblem

divider