Find the Mean and Median:
Method 1: (fast and easy)
Go to a Calculator Page.
Press and choose #1 Calculator. Hit ENTER. and choose #1 Calculator. Hit ENTER.
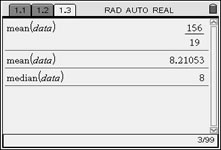
Press  (Catalog), then M, and choose mean( or median(. (Catalog), then M, and choose mean( or median(.
These commands can also be used with direct entries, such as:
mean({3, 4, 5, 6}) gives an answer of 4.5
(the french curly braces are under the catalog key template)
mean({3, 4, 5}, {1, 2, 3}) gives an answer of 13/3.
The values are actually 3, 4, 4, 5, 5, 5, where the second set indicates the number of entries of each corresponding value in the preceeding set..
|
Syntax: mean(List[, freqList[ )
If each data entry is to be considered only once, the freqList[ is one and need not be entered.
In this example, the decimal approximation was achieved using CTRL and  . .
Syntax: median(List[ )
List[will be the name of the list where the data resides, or you may enter the data directly, as seen at the left in reference to mean. |
Find the Mean and Median:
Method 2: (a bit more sophisticated)
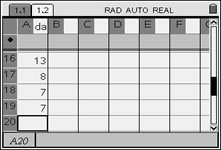
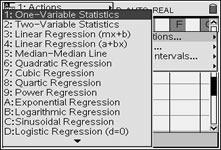
From the List & Spreadsheet Page, press
 , #4 Statistics, #1 Stat Calculations, and choose #1 One-Variable Statistics. , #4 Statistics, #1 Stat Calculations, and choose #1 One-Variable Statistics. |
|
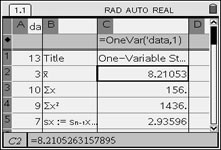
The choice "Open Variable Statistics" yields the following results back to the spreadsheet columns. One column will "label" these values, while the following column will contain the actual results.
|
= mean |
|
= the sum of the data |
|
= the sum of the squares of the data |
sx |
= the sample standard deviation |
|
= the population standard deviation |
n |
= the sample size (# of pieces of data) |
MinX |
= the smallest data entry |
|
= data at the first quartile |
MedianX |
= data at the median (second quartile) |
|
= data at the third quartile |
MaxX |
= the largest data entry |
SSx |
= the sum of squared deviations of x from the
mean of x. |
|
When prompted for the
number of lists, enter 1.
These columns have been widened
for
ease of reading.
See Lists and Spreadsheets
for directions on resizing.
|
Find the Mode: (While there is no specific calculator function to find the mode, the calculator is helpful in ordering the data so that you can find the mode easily.)
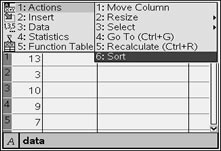
Sort the data into ascending or descending order to help find the mode.
From the List & Spreadsheet Page, press , #1 Actions, #6 Sort. Choose ascending or descending order.
|
Once the data list has been sorted, you can easily examine the list to see which value(s)
appear(s) most often.
The mode for this data set is 7 and 9.
Each of these values appears 3 times
in the data set.
|